

Once every eleven years, the Sun exhibits a marked increase in activity before reverting to a more quiescent state. We will elucidate the origins of this cyclical rhythm and the reasons why predicting the behavior of our star remains challenging.
The deceptive constancy of our star
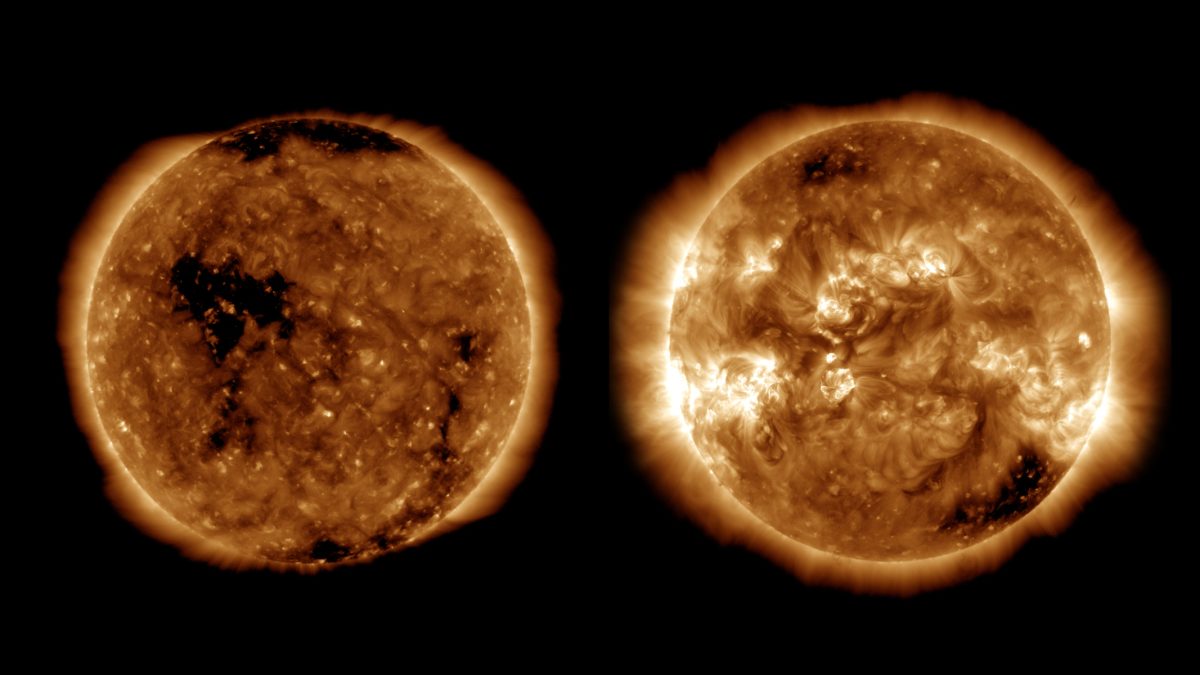
Every morning, the Sun ascends beyond the horizon, mirroring its emergence from a millennium ago. It appears unchanging to us; however, in actuality, its activity exhibits cyclical variations approximately every eleven years. At the beginning of the cycle, solar activity gradually increases. More and more spots and active regions appear on the surface of the Sun, its magnetic field becomes more complex, the movement of hot plasma on the surface becomes more turbulent, and, as a result, flares and ejections of matter into space become more frequent. Particles and magnetic structures from some of these events reach the Earth and interact with its magnetosphere. This can cause geomagnetic storms, create problems for satellites and radio communications, and the auroras become brighter and can be visible even at unusually low latitudes. After the maximum, activity gradually decreases. The number of sunspots, flares, and coronal ejections on average becomes smaller, and the Sun moves to solar minimum. Then the cycle begins again. And so on from cycle to cycle.
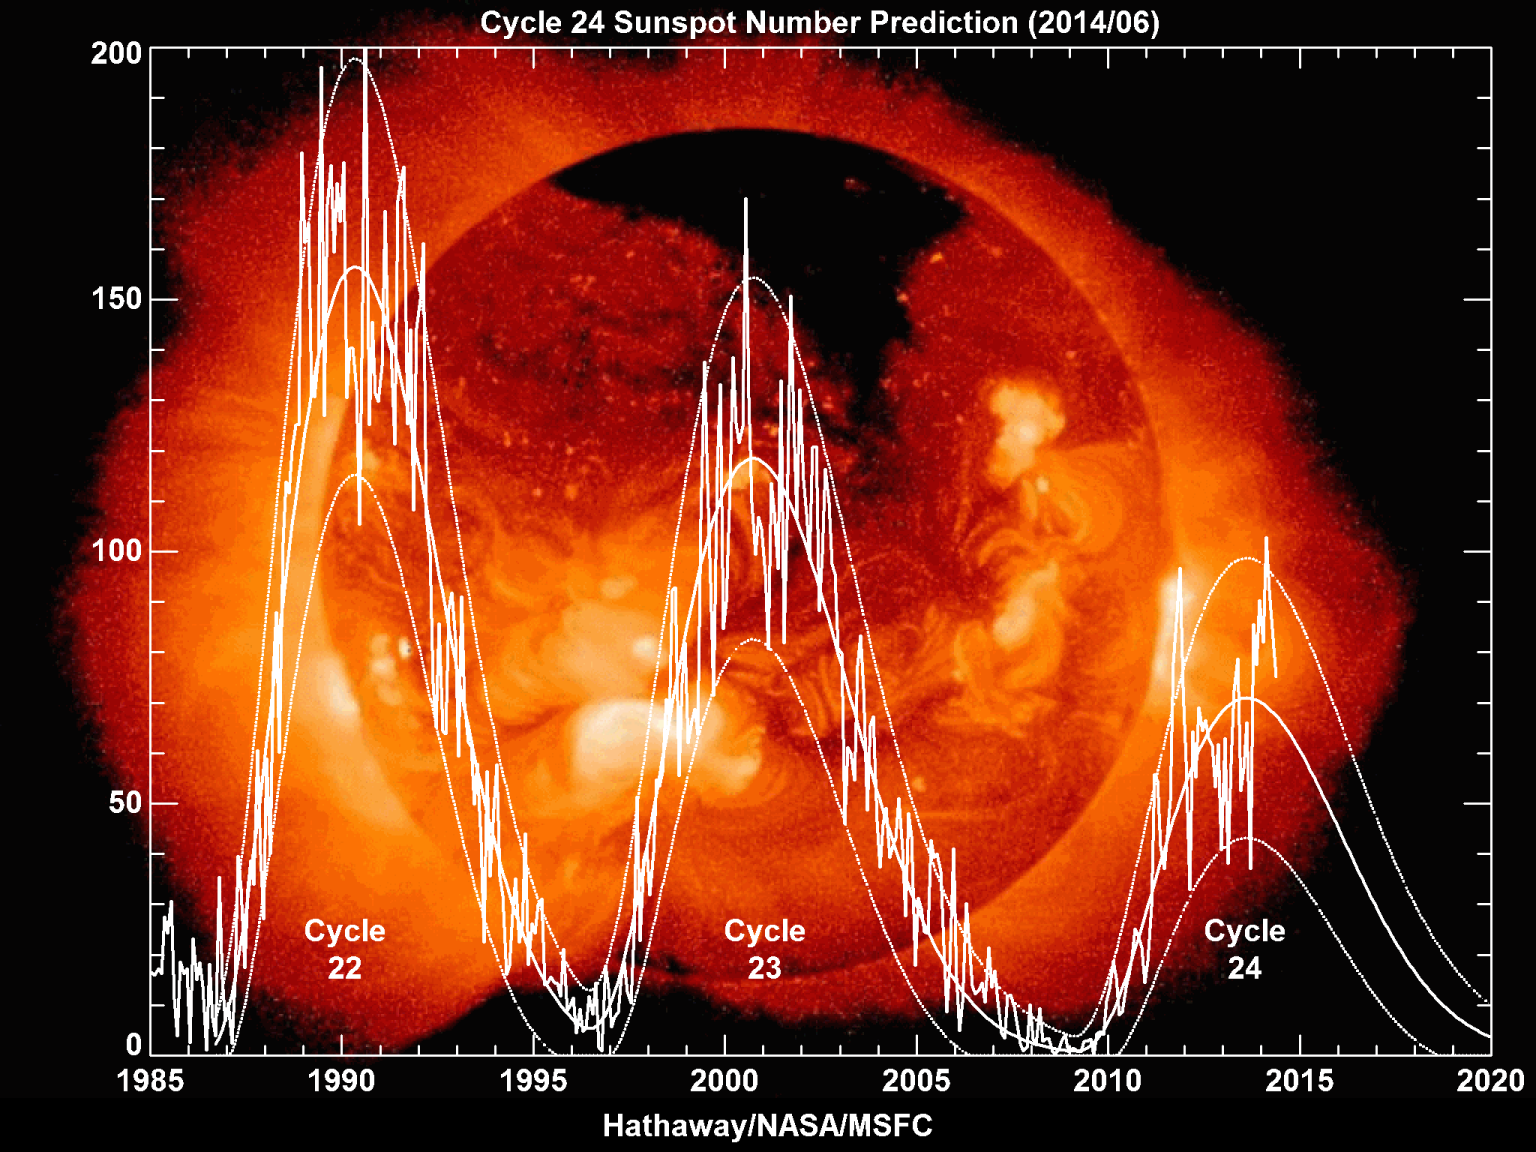
This rhythm was noticed as early as the 19th century, although astronomers had observed sunspots themselves much earlier. One of the earliest dated records belongs to Johannes Kepler: in 1607 he observed the Sun using a pinhole camera. However, Kepler mistakenly thought that the dark spot on the Sun’s disk was Mercury passing in front of the Sun. It was not until 1843 that the German astronomer Heinrich Schwabe drew attention to the approximately 10-year periodicity of changes in the number of sunspots. Later, the period was refined to approximately 11 years. The explanation for this cycle is related to the Sun’s magnetic field, which changes along with the motion and differential rotation of the plasma inside the star. In the early 20th century, astronomers finally had the opportunity to directly study the magnetic fields of sunspots – something that astronomers of the past could not investigate without the instruments available to us today.
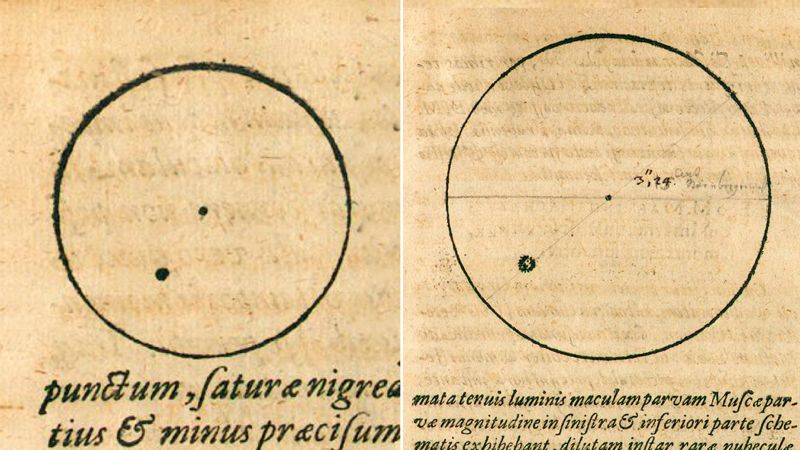
Credit: Johannes Kepler
The accidental discovery of the solar cycle
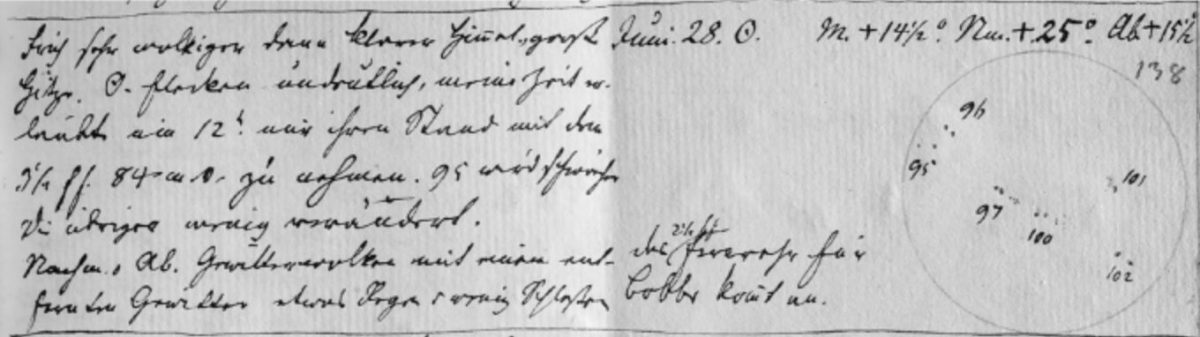
In 1826, German amateur astronomer Samuel Heinrich Schwabe initiated a search for an elusive hypothetical planet thought to orbit closer to the Sun than Mercury. To prevent missing its transit across the Sun’s disk, he meticulously documented all dark spots observed through his telescope daily. Although he did not discover the planet, he amassed seventeen years of consistent observations, employing the same method throughout, and discerned a periodic pattern within the data. The number of sunspots fluctuated in a cycle of approximately ten years. Samuel Heinrich Schwabe subsequently published his findings in the early 1840s in the esteemed astronomical journal Astronomische Nachrichten.
The Swiss astronomer Rudolf Wolf undertook the subsequent step. He meticulously examined observatory archives and assembled fragmented observations dating from 1745 — systematic records before that period did not exist. Utilizing this extended series, the interval was revised to eleven years. Additionally, Wolf established the numbering system that remains in use today, commencing with the cycle initiated in 1755. The current cycle is designated as number 25.
The reasons why sunspots became the primary measure of solar activity are evident in the era’s practices. They are observable even with basic telescopes, whereas solar flares were first documented only in 1859, and material outbursts from space were not detected until the 1970s. Sunspots continue to serve as a practical indicator today, although solar radio emissions are now also employed alongside them.
The methodology scientists use to monitor the solar cycle. Source: NASA Goddard Space Flight Center
What is the origin of this rhythm?
Sunspots have been observed since the time of Samuel Heinrich Schwabe, but their true nature was not understood until 1908. At that time, American astronomer George Ellery Hale studied the light emanating from sunspots and discovered characteristic changes in it that occur only in a very strong magnetic field. Since then, it has become clear that sunspots are merely a visible sign, and the cause of the cycle must be sought in the behavior of the magnetic field inside the Sun.
This behavior is atypical. The Sun’s surface is designated as the photosphere — namely, the visible stratum from which light is emitted. The Sun, of course, does not have a regular solid surface: the photosphere consists of very hot plasma. This is a state of matter in which the gas is largely ionized: along with neutral particles, it contains charged ions and free electrons. It is this mobile electrically conductive substance that forms the complex magnetic field of the Sun. Plasma conducts electric current well, and the magnetic field moves with it, as if frozen inside. This connection is two-way: the flows of matter seem to drag the magnetic field along with them, and a sufficiently strong field, on the contrary, slows down their movement.
The plasma exhibits variable rotational velocities across different latitudes. The equatorial zone completes a complete rotation in about 25 days, while at high, near-polar latitudes the rotation takes about 35 days. This difference in speed gradually deforms the Sun’s poloidal magnetic field: its field lines stretch in the direction of rotation and increasingly wind around the Sun, forming a toroidal component of the magnetic field. This part of the solar dynamo mechanism is called the omega effect.
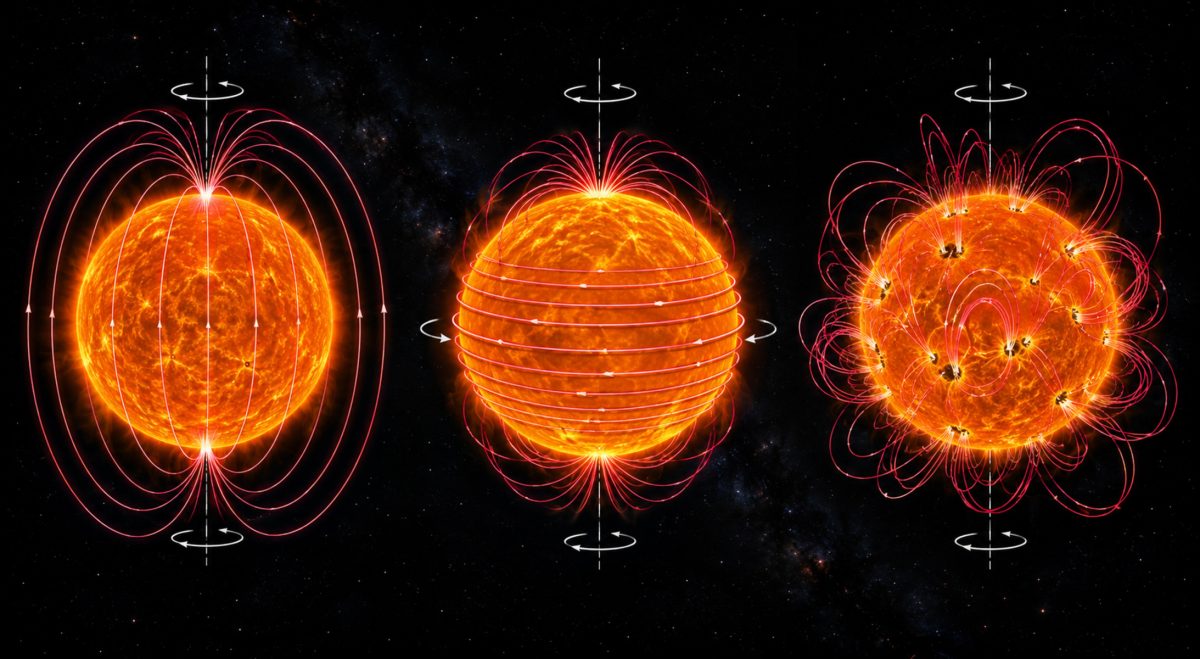
The second component of the mechanism functions concurrently with the first. In the Sun’s outer layer, hot plasma ascends, cools, and descends, while rotational forces twist these flows similar to the manner in which cyclones are twisted in Earth’s atmosphere. The reversed magnetic field generated by this twisting gradually reverts to its original configuration, with the north magnetic pole occupying the position previously held by the south pole. This process occurs approximately at the peak of solar activity. This phenomenon is known as the alpha effect and remains a subject of considerable debate among researchers. Collectively, these two components constitute the solar dynamo.
The magnetic field beneath the Sun’s surface exhibits an uneven distribution. In areas where the magnetic field is particularly strong, it affects the movement of the plasma and can make a magnetically saturated region buoyant. It rises through the Sun’s mass, carrying with it the magnetic flux. Near the surface, the magnetic field can emerge in arcs and loops, while their ends remain submerged in the plasma. A strong magnetic field suppresses the convective transfer of energy from the depths, so where such a loop emerges, the surface becomes colder than the surrounding area. This is how a sunspot appears. The more complex and tangled the field becomes, the more often loops of opposite direction come together and reconnect. During such magnetic reconnection, some of the stored magnetic energy is quickly released. This can cause powerful solar flares, and under certain conditions, coronal mass ejections, when huge amounts of plasma are ejected into interplanetary space.
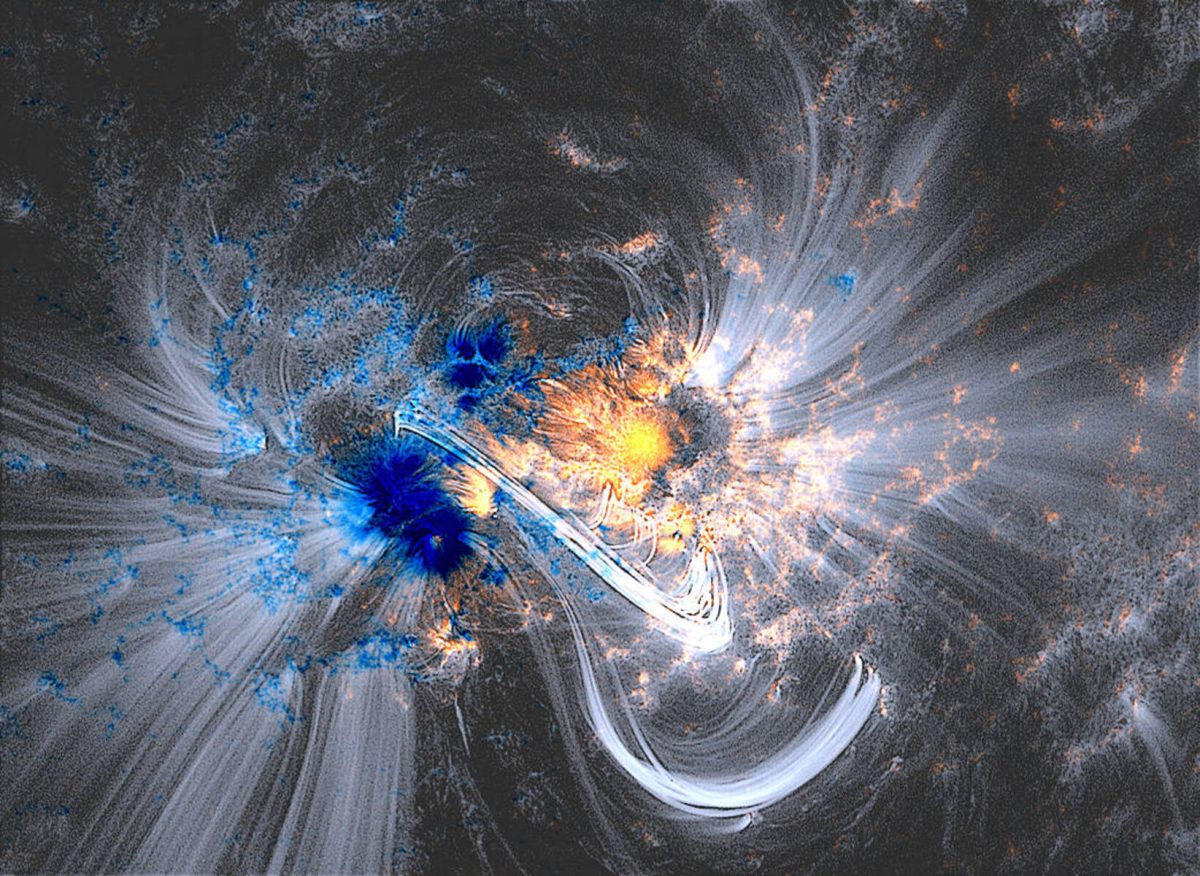
The concept of such a mechanism was first proposed by the Irish physicist Joseph Larmor in 1919. However, the theory still does not elucidate why one of its cycles precisely endures eleven years. Individual cycles vary from nine to fourteen years, with an average of eleven. Currently, it remains infeasible to accurately predict either the duration or the intensity of the subsequent cycle.
Why the area is not actually dark
On the Sun itself, sunspots remain the most conspicuous manifestation of this phenomenon, and their designation leads to a common misconception. The term “spot” implies a defect or a void, although in reality it refers to the same incandescent material, but cooler than the adjacent regions. The photosphere is heated to approximately 5,500 degrees Celsius, whereas a sunspot reaches about 3,500 degrees in temperature. Consequently, the material within a sunspot emits roughly one-fifth of the light emitted by the surrounding surface, and this contrast is what renders the sunspot dark.
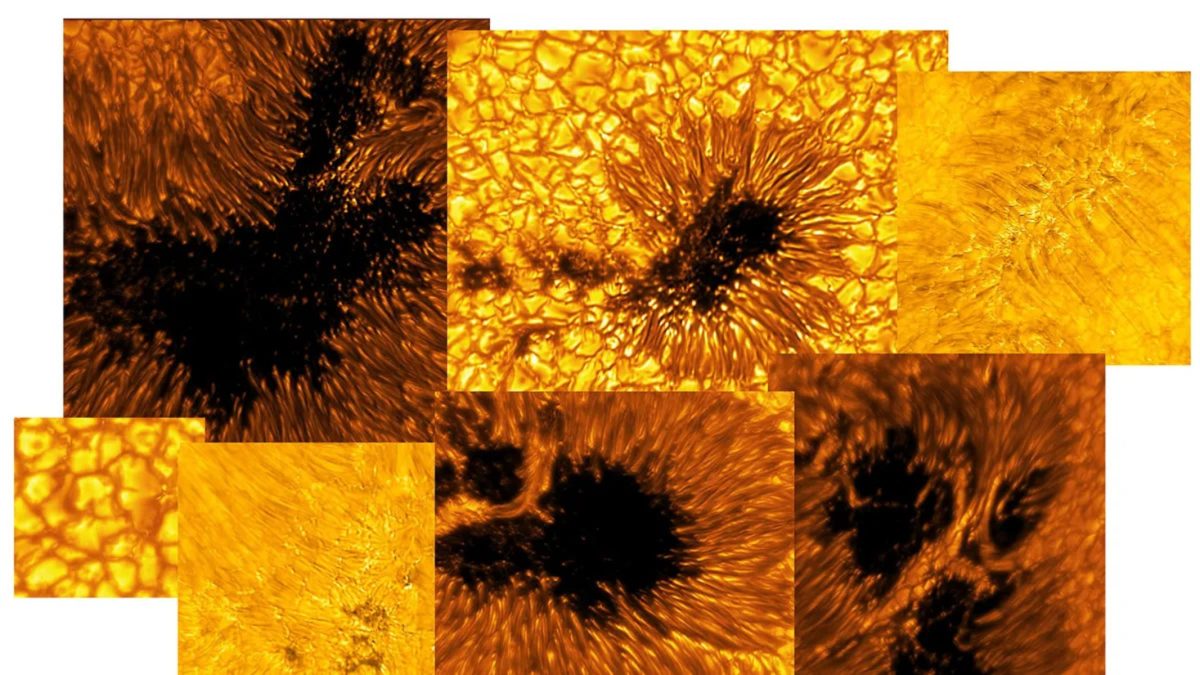
The smallest sunspots measure approximately 1,600 kilometers in diameter, whereas the largest can extend up to 160,000 kilometers — approximately twelve times the diameter of Earth. The most intense flares and eruptions originate above these substantial sunspot clusters. These phenomena reach us through multiple pathways.
The radiation from a solar flare reaches Earth in about 8 minutes. It cannot be seen directly with the naked eye, as much of the additional radiation is in the X-ray and ultraviolet ranges. It quickly ionizes the ionosphere on the illuminated side of the Earth. Changes in the ionosphere also affect the transmission of signals from satellite navigation systems.
Coronal ejections of matter move much slower than light and arrive in a few days. They cause magnetic storms, and with them the auroras, which on such days can be seen much further south than usual. Due to strong changes in the Earth’s magnetic field, induced currents arise in long conductors – in particular in power lines. They can create additional load on power grids and transformers, and during particularly strong storms – cause outages and even damage to equipment. A geomagnetic storm also heats and expands the upper layers of the atmosphere. Because of this, at the altitudes of low Earth orbits, the density of the atmosphere increases, satellites experience greater aerodynamic resistance and lose orbital altitude more quickly. Energetic charged particles can also directly affect space technology: they cause single failures in electronics, charge accumulation and, if there is enough energy, damage to microcircuits. The cumulative effect of radiation gradually deteriorates the characteristics of electronics and solar cells. During periods of high solar activity, such phenomena generally occur more frequently than near solar minimum.
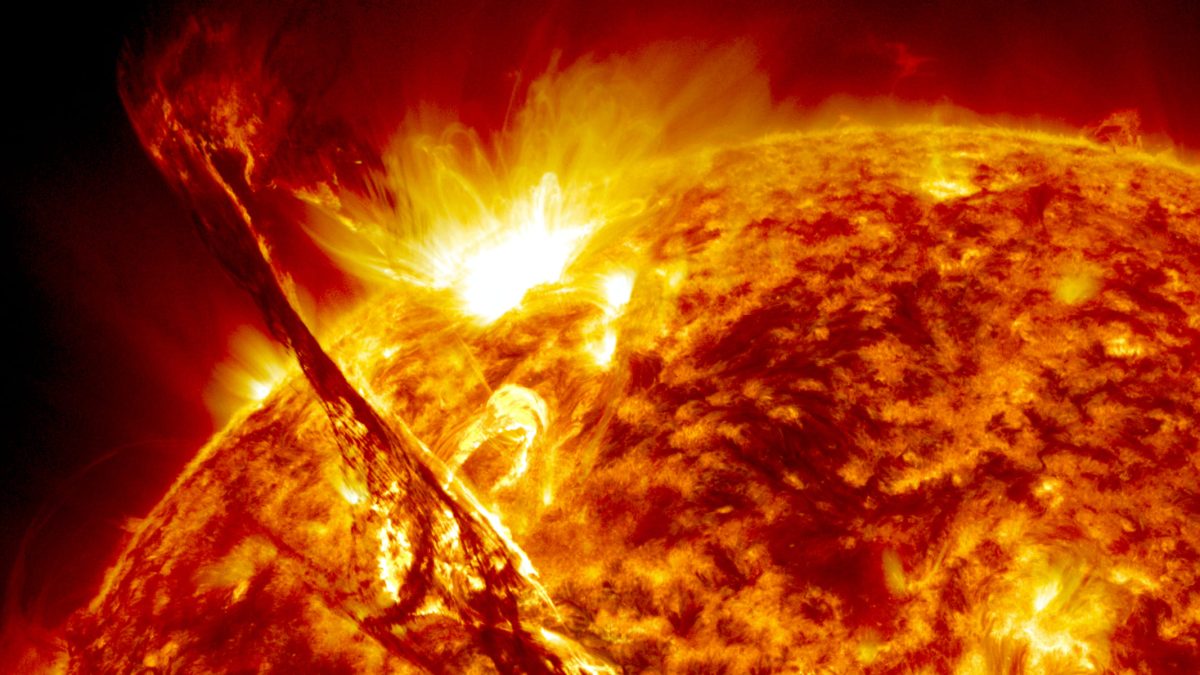
This remains, however, merely a preliminary guideline. Predicting a specific flare is unattainable, and severe storms have been documented on numerous occasions even during the declining phase, when overall activity was diminishing.
What is currently occurring with the Sun?
The current, 25th solar cycle has shown how difficult it is to make such predictions accurately. In 2019, an international group of experts from NOAA, NASA and ISES predicted that the maximum of the cycle would fall on July 2025, and the smoothed sunspot number would be about 115. In fact, the Sun entered the maximum period earlier than the baseline forecast predicted – already in 2024. At the same time, activity turned out to be much higher than predicted: the smoothed sunspot number exceeded 160. This number does not simply mean the number of spots that are simultaneously visible on the Sun’s disk. The international sunspot number takes into account both the spots themselves and their groups. Therefore, this indicator is an index of overall solar activity, and not a simple count of spots. And the exact moment of solar maximum is determined only retrospectively – based on a smoothed series of observations. Because of this, we can only talk about the “maximum date” after it becomes clear in which month the smoothed activity reached its highest value.
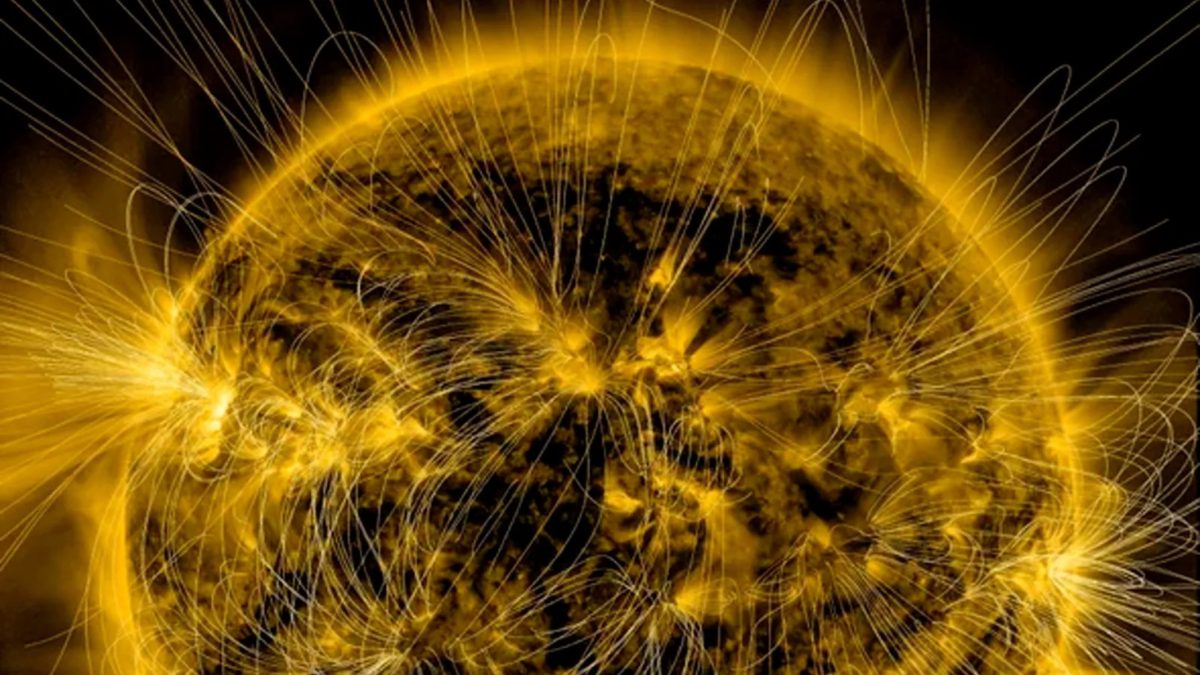
Approximately concurrently, the polarity of the Sun’s poles underwent a reversal. Based on measurements from the Japanese Hinode spacecraft, this event likely occurred in October 2024 in the southern polar region, with the northern polar region experiencing the reversal approximately one month later.
The activity is presently declining and is projected to continue decreasing until reaching a minimum around the year 2030. Subsequently, Cycle 26 will commence, and at its peak — approximately in the mid-2030s — the polarity will reverse once more, reverting the magnetic field to its pre-2024 state. It has been observed that the interval between two activity minima is approximately eleven years, as evidenced by the frequency of sunspots and solar flares. During this period, the solar poles undergo a single polarity reversal. To complete another such reversal and return to the initial configuration, an additional cycle is necessary; thus, a complete magnetic cycle is estimated to span approximately twenty-two years.