The European Space Agency (ESA) has published a series of images of European cities showing their temperature at the height of the recent heatwave.
Record heat
June 2022 was one of the hottest months on record. In a significant part of the United States, Asia and Europe, the average temperature was about 10° C higher than the climatic norm.
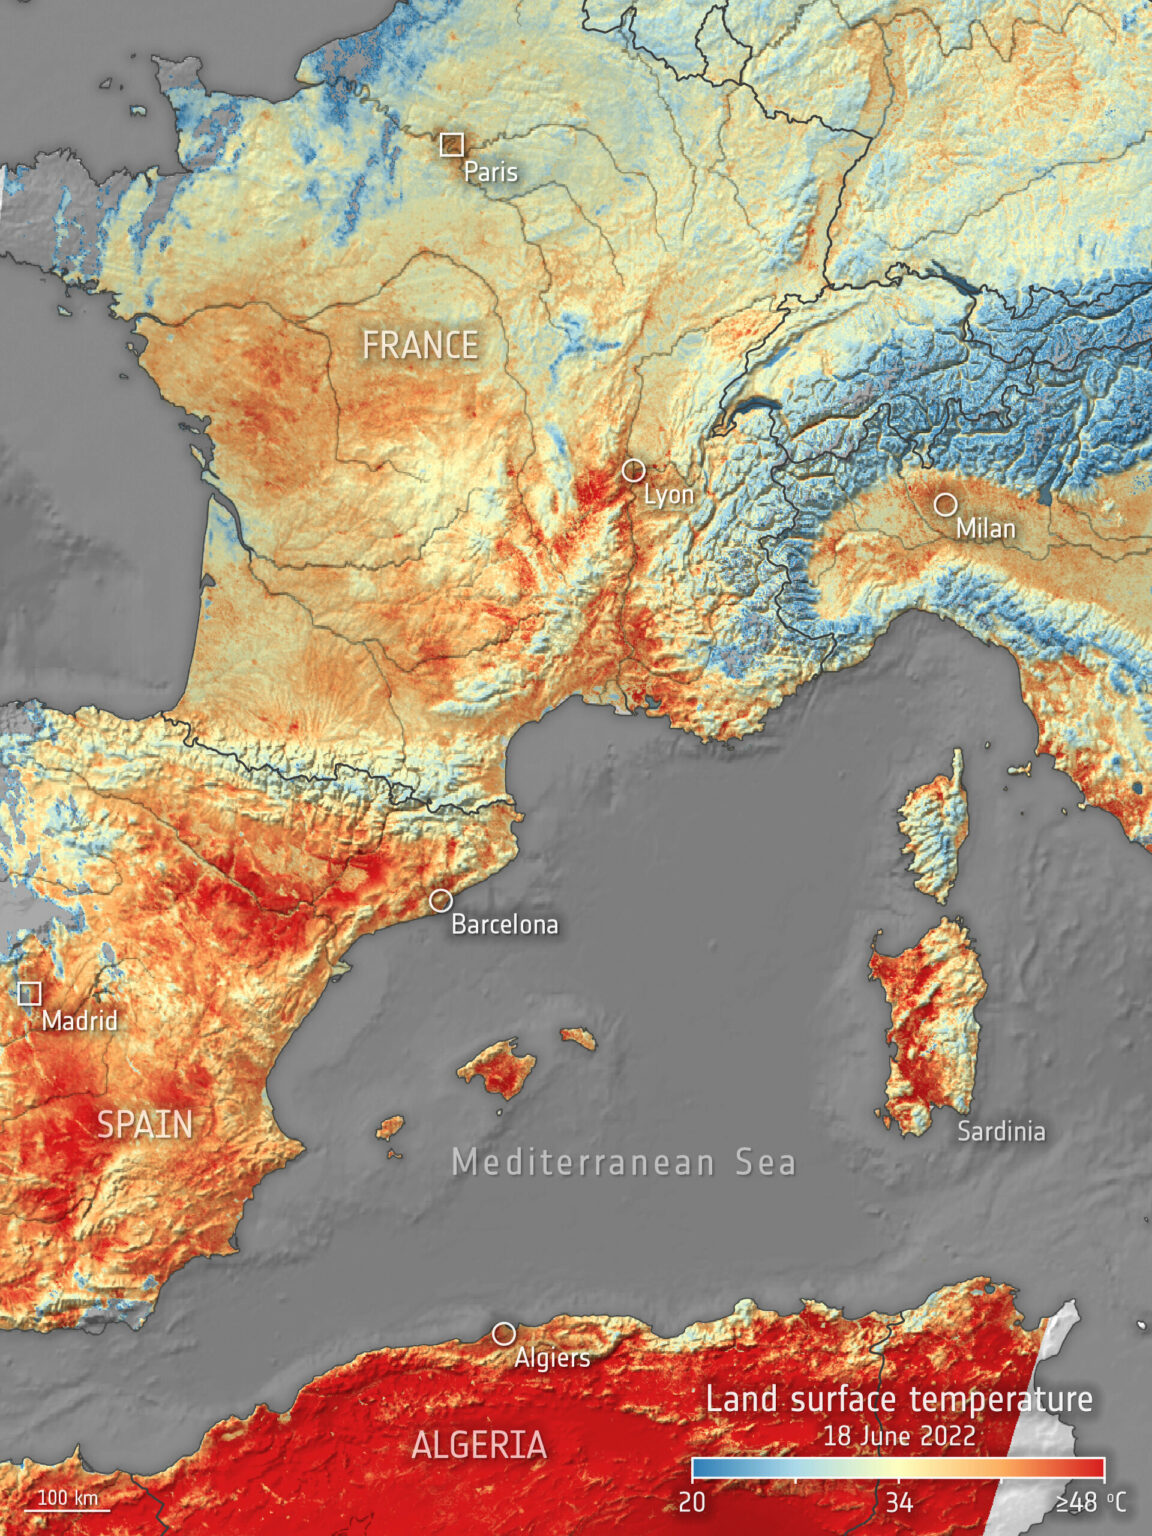
Such heat waves are especially dangerous for residents of large cities. A large number of surfaces that absorb solar radiation well (asphalt roads, buildings) and the absence of vegetation leads to the formation of so-called heat islands above them. As a result, in large cities, the temperature difference between the central districts and the suburbs can be 10-15 °C.
Heat islands in European cities
In order to better understand the effects created by heat islands, ESA conducted a survey of a number of European cities. For this, the ECOSTRESS installed on board the ISS was used. Paris, Prague and Milan were in the frame. The pictures were taken on June 18 shortly after noon.
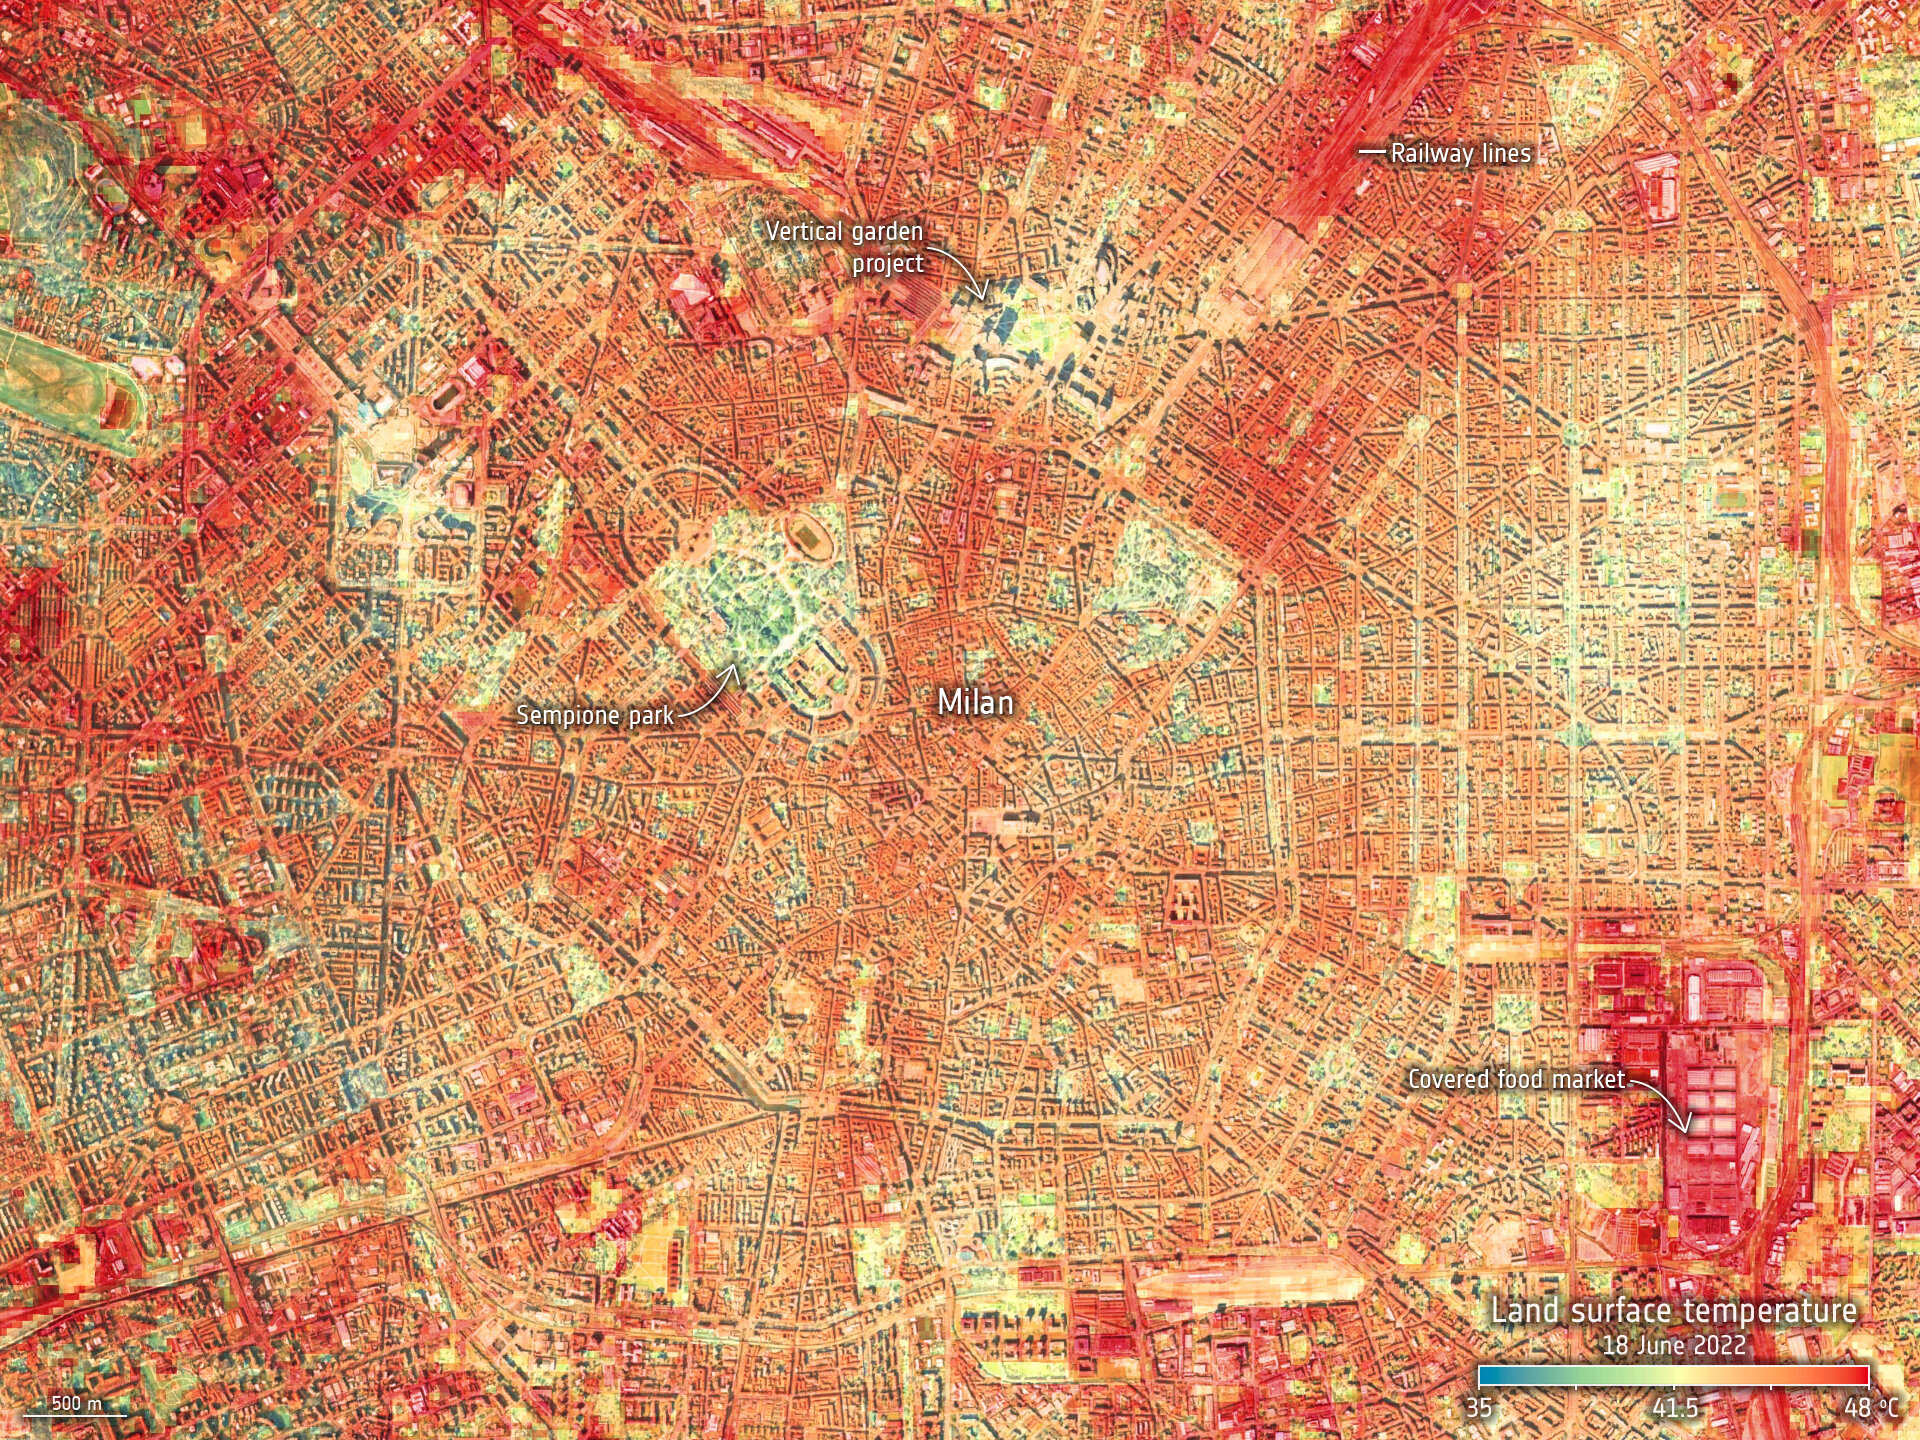
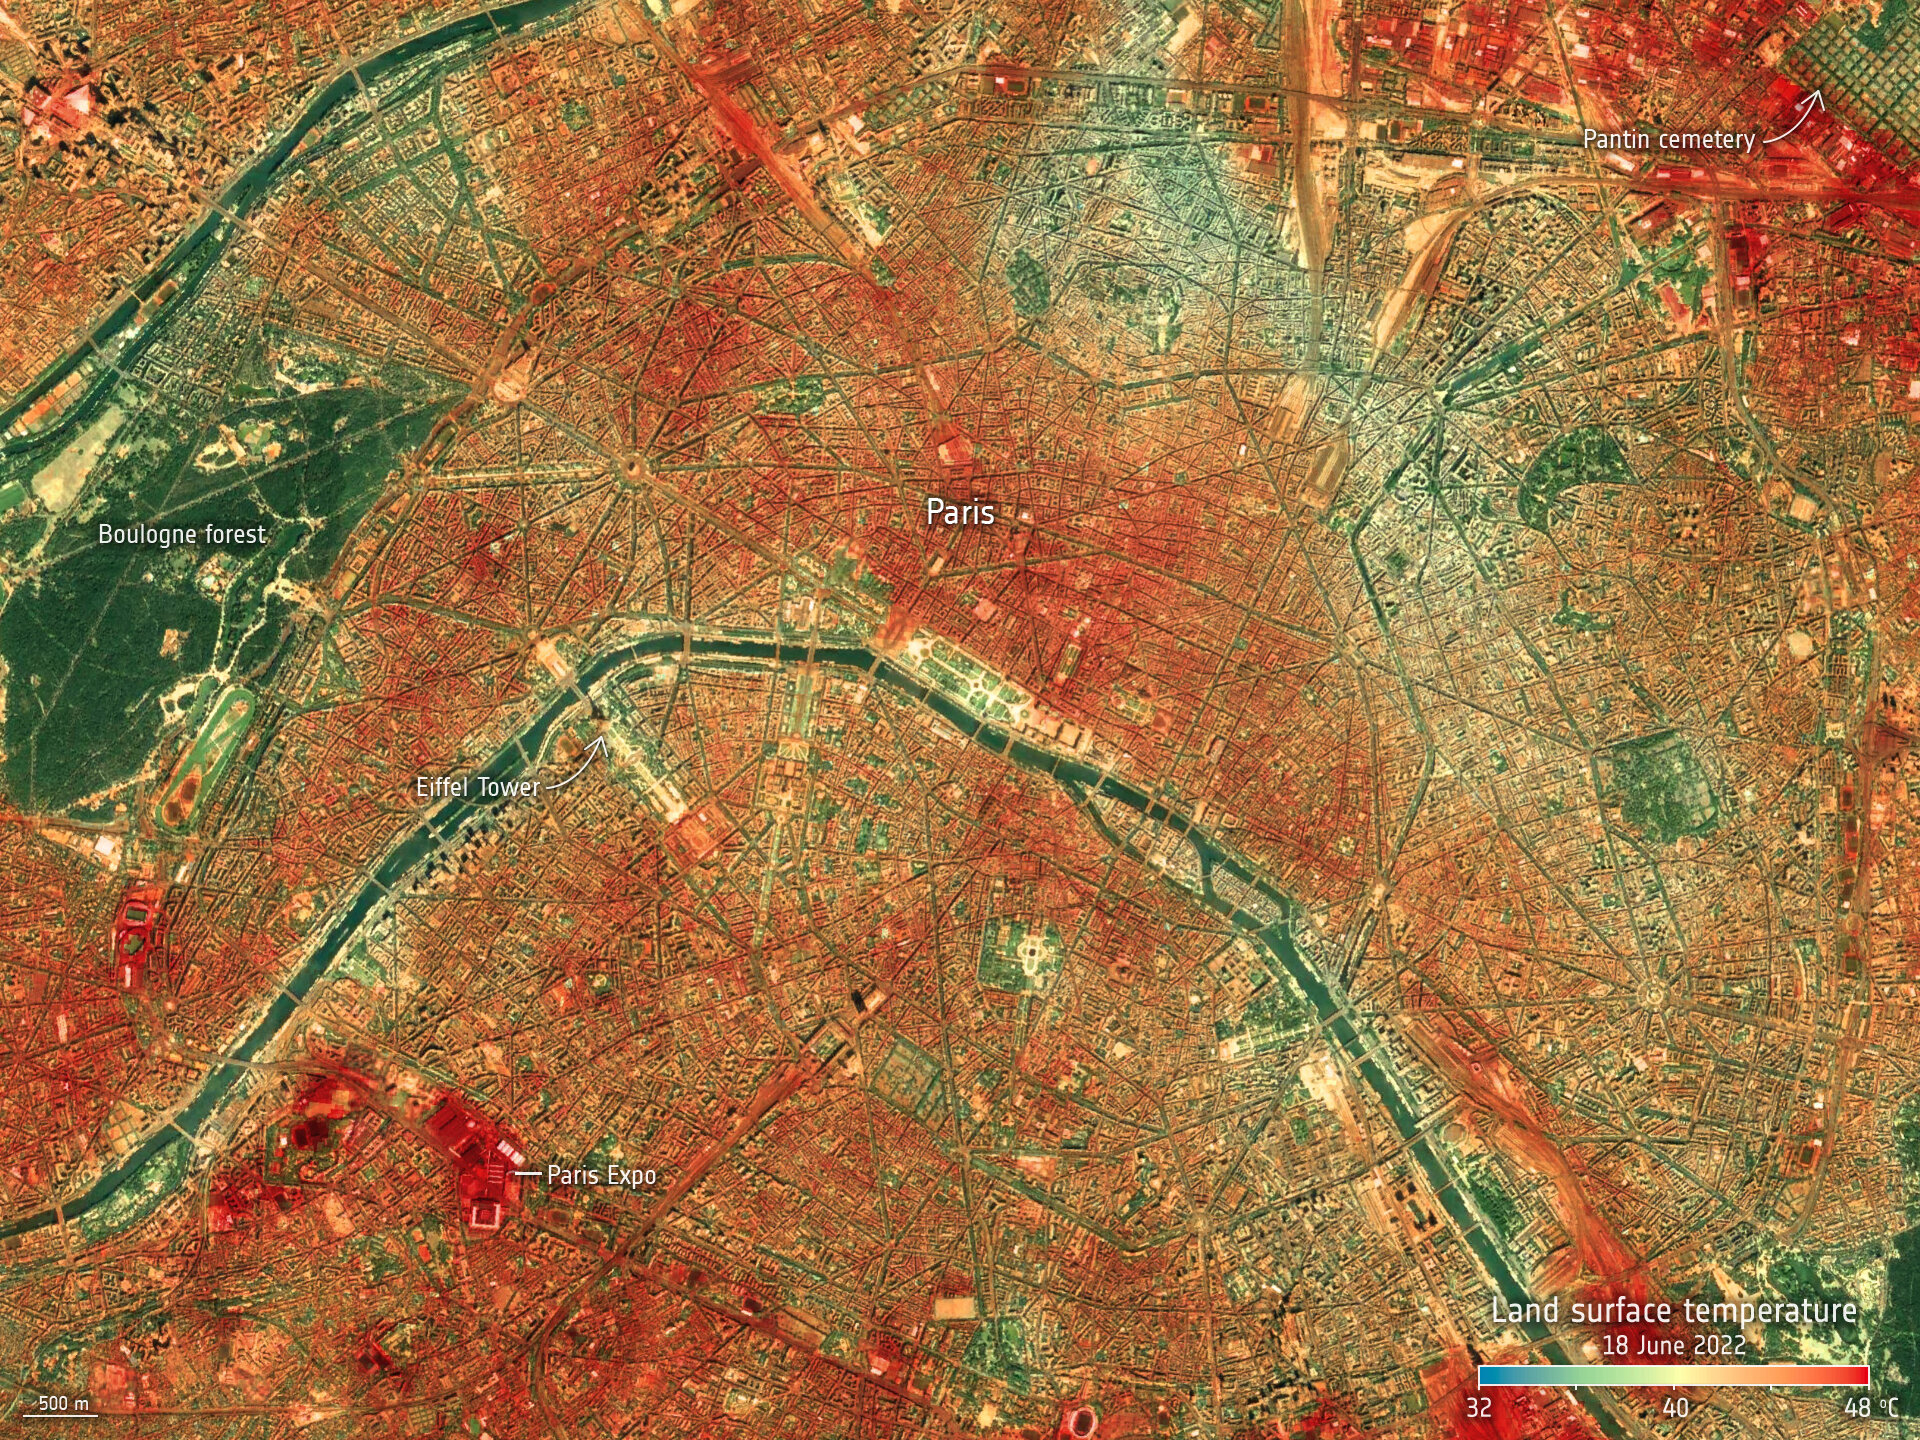
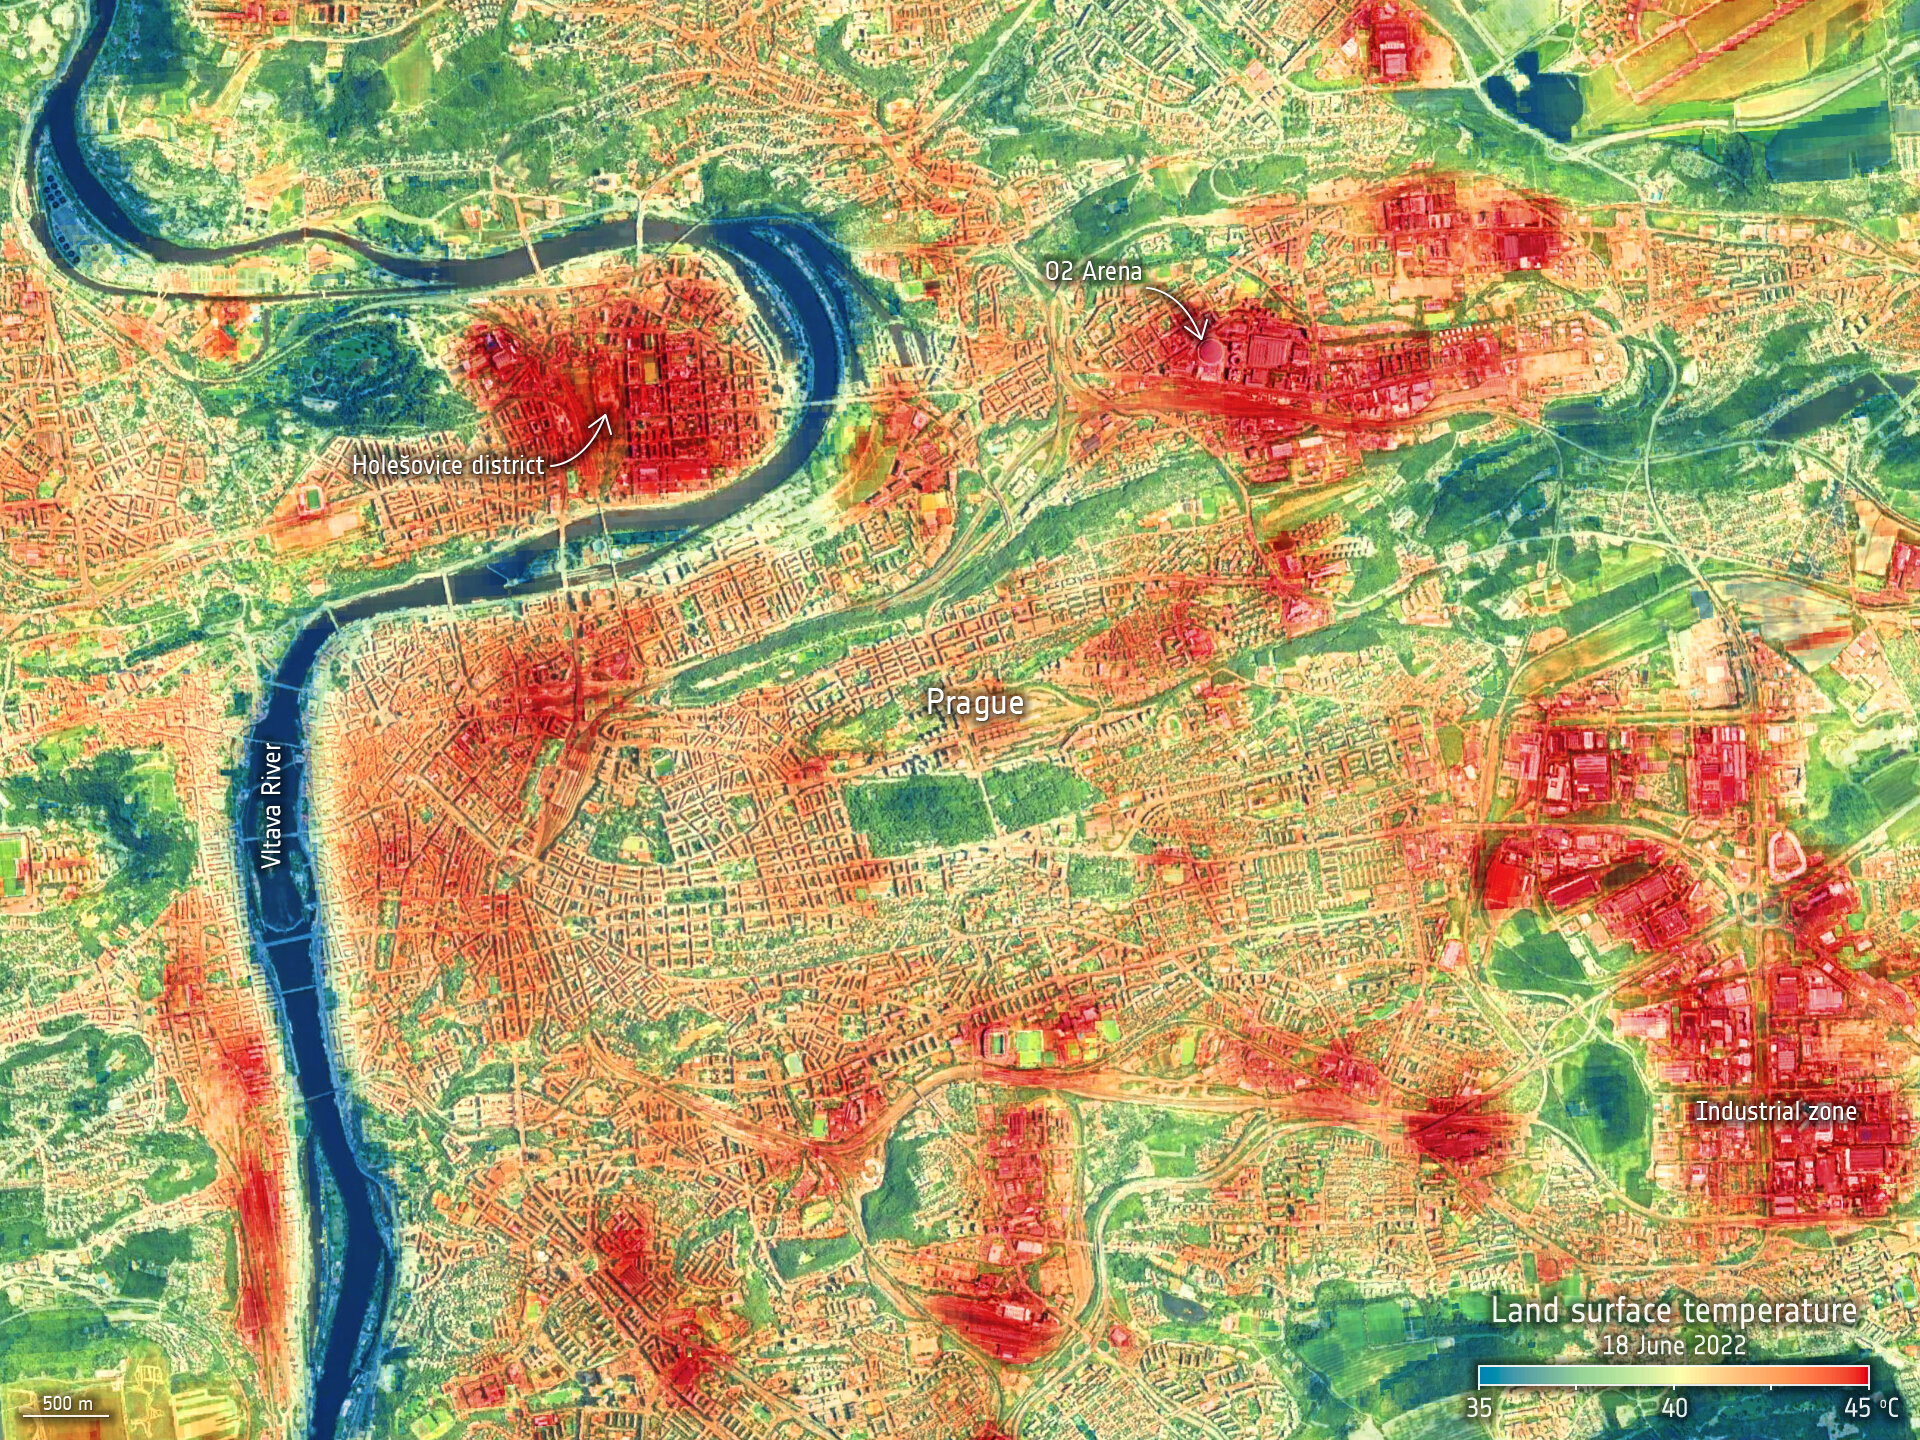
The resulting images clearly demonstrate to what high temperatures urban buildings can warm up — especially large structures and areas with dense buildings. It is also easy to notice what an important role rivers and parks play, actually acting as “oases” of coolness.
According to scientists, the data obtained during these observations in the future can be used in planning urban development and infrastructure improvements.
Earlier we told how, based on NASA satellite images, scientists tracked how river sediments changed.
According to https://www.esa.int
Follow us on Twitter to get the most interesting space news in time
https://twitter.com/ust_magazine
