

Arctic sea ice shrank to its annual minimum this September. The figure once again ranked among the lowest in the history of satellite observations, while the winter maximum tied last year’s record low. Scientists attribute the long-term decline in ice extent to the combined effects of natural climate variability and global warming. Observations are carried out using satellites equipped with microwave sensors whose signals can pass through cloud cover.
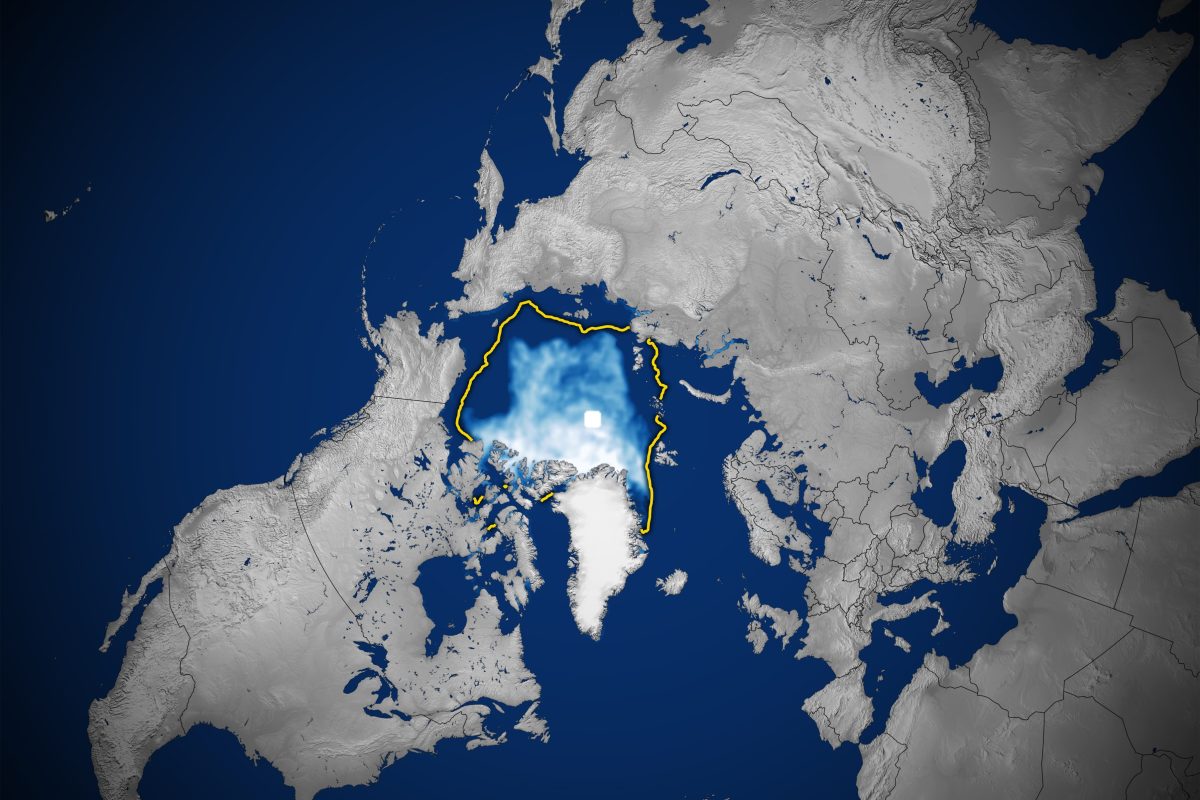
Tenth-Lowest Minimum
Arctic sea ice reached its smallest extent of the year on September 12. That day, it covered about 4.6 million square kilometers of ocean, according to NASA Earth Observatory. By this measure, 2026 tied for tenth place among the lowest annual minimums, alongside 2008, 2010, and 2025.
The average September minimum between 1981 and 2010 was about 6.22 million square kilometers. The absolute record low was recorded in September 2012, when the ice extent fell to approximately 3.39 million square kilometers. This year’s result is closer to the record than to the long-term average. It is more than 1.6 million square kilometers below the average, an area roughly equivalent to three times the territory of Ukraine.
The Melt Cycle and Long-Term Decline
Sea ice in the Arctic Ocean follows the same cycle every year. During the polar winter, it expands and usually reaches its maximum in March, while over the summer it melts to a September minimum. These seasonal fluctuations have continued for thousands of years, but since satellite monitoring began, both the annual maximum and minimum have declined noticeably.
Continuous satellite observations have been available since the end of 1978. The decline in ice extent accelerated in the 2000s. Since then, every summer from 2007 through 2026 has ranked among the 20 lowest minimums on record.
In recent years, the September minimum has remained relatively stable. Weather has a major effect on how much ice melts during any particular summer. According to NASA scientists, increased cloud cover over the past decade has reduced the amount of sunlight that could otherwise have accelerated melting even further. Even at this plateau, however, the summer minimum remains well below the long-term average.
Younger and Thinner Ice
There is less multiyear ice in the Arctic — ice that has survived at least one melt season. It is increasingly being replaced by thinner, first-year ice.
The winter maximum is also shrinking. The March 2026 peak statistically tied the record-low maximum recorded in 2025, according to the National Snow and Ice Data Center.
Ice extent is influenced by natural cycles such as the Arctic Oscillation, a periodic shift in atmospheric pressure between the polar region and the mid-latitudes. However, these cycles alone cannot explain the entire decline observed during the satellite era. Natural variability is interacting with rising global temperatures, causing increasing amounts of ice to melt. According to projections by the Intergovernmental Panel on Climate Change, the Arctic could become practically ice-free in summer at least once before the middle of the 21st century.
Looking Through the Clouds
To determine ice extent, scientists use satellites equipped with passive microwave sensors. These instruments detect microwave energy naturally emitted by Earth. In this part of the spectrum, sea ice produces a stronger signal than open water, allowing it to stand out clearly in the data. Microwaves pass through clouds, so observations can be made regardless of weather conditions.
The first data were collected in 1978 using NASA’s Nimbus 7 spacecraft. Starting in 1987, observations from the U.S. Defense Meteorological Satellite Program (DMSP) satellites supplemented the data, and from 2002 to 2011 they were also supplemented by NASA’s Aqua satellite. Since 2025, scientists have been using data from Japan’s GCOM-W satellite, operated by the Japan Aerospace Exploration Agency.
The white circle in the center of each map represents the so-called polar hole. Because of the inclination of satellite orbits, the spacecraft do not pass directly over the North Pole, making it historically impossible to obtain data for the area around it. The size of this gap depends on the instrument. It is noticeably smaller on newer satellites. When calculating ice extent, scientists assume that this area is completely covered by ice.