
NASA provided an impressive animation of the distribution of almost all the water on our planet on a new global map of the world’s oceans. It was created based on data collected by the SWOT (Surface Water and Ocean Topography) satellite. It studies the topography of the surface of water bodies.
Animation provides an opportunity to observe the difference in height of the sea surface as well as freshwater lakes and rivers around the world. The data were collected during the first 21 days of SWOT’s stay in orbit, from July 26 to August 16.
Scientists had already evaluated the results and were pleasantly surprised by the data received from this satellite. The head of the SWOT project at NASA’s Jet Propulsion Laboratory in Southern California, Parag Vaze, called this information “simply incredible”.
SWOT Mission
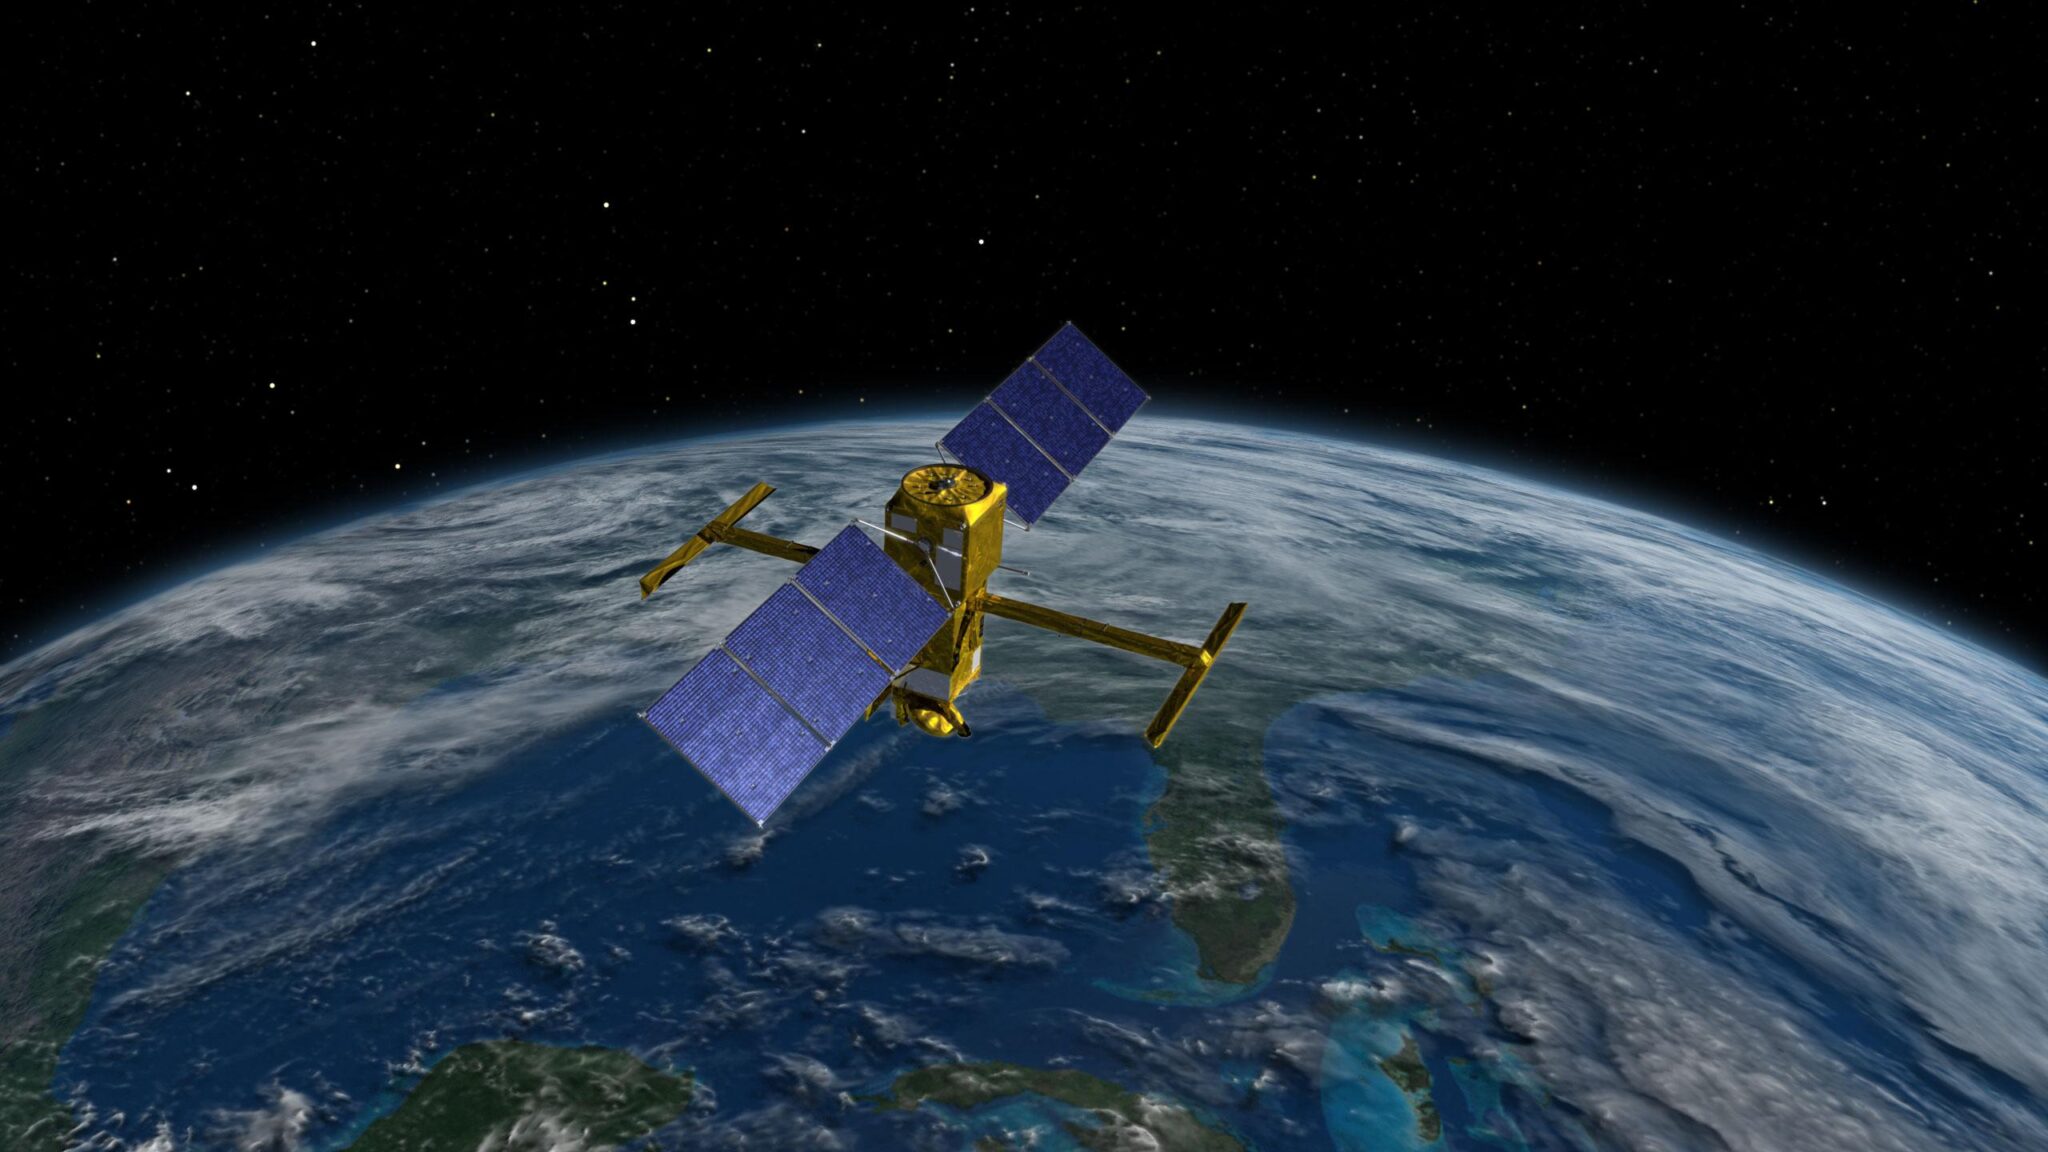
SWOT was launched into orbit on December 16, 2022, thanks to the Falcon 9 launch vehicle (SpaceX) from the launch complex 4E at the Vandenberg Space Force Base in California. This satellite was created jointly by NASA and the French Space Agency (CNES).
During its mission, SWOT will regularly measure the height of water on 90% of the globe every 21 days, which will record changes in the global level of the water surface. These data are important for studying the impact of climate change and global warming.
How the animation was created
The new animation was created using data from the Ka-band satellite radar interferometer (KaRIn). It consists of two antennas separated by an arrow 10 meters long. This tool is used to collect data on the height of the surface by irradiating it with radar pulses.
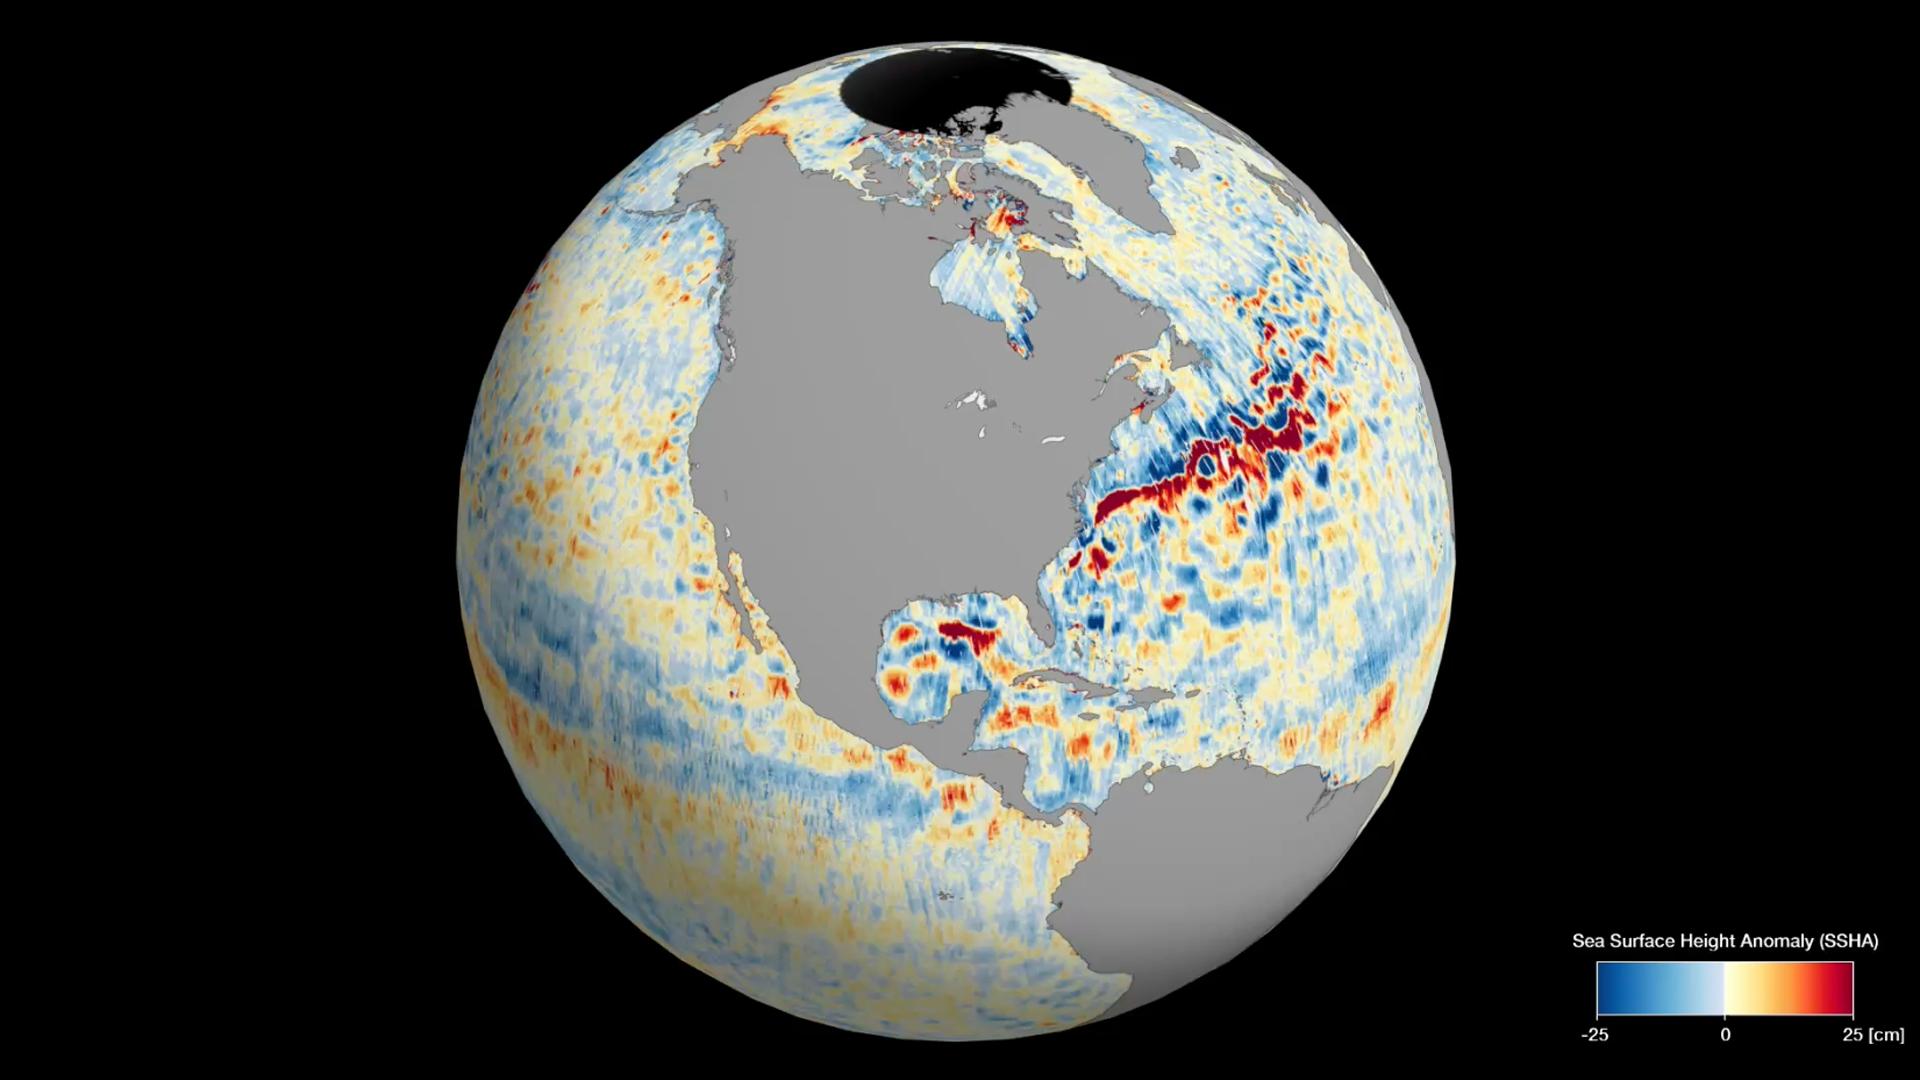
The animation shows different heights of the sea surface in different parts of the world, indicating areas with high (red and orange shades) and low (blue) water levels. The data collected by SWOT provides the most detailed and comprehensive view of the water resources on our planet.
Forecasting global climate events
These data can also reveal important information about ocean currents — such as the Gulf Stream — and point to regions with warmer water during global events like El Niño. The expansion of water under the influence of an increase in temperature can be detected by a change in the height of the sea surface. In general, SWOT data opens up new opportunities for scientific research and helps us better understand the Earth’s water resources.
Earlier we reported on how ancient Mars was covered by an ocean 300 meters deep.
According to Space
Follow us on Twitter to get the most interesting space news in time
https://twitter.com/ust_magazine
