
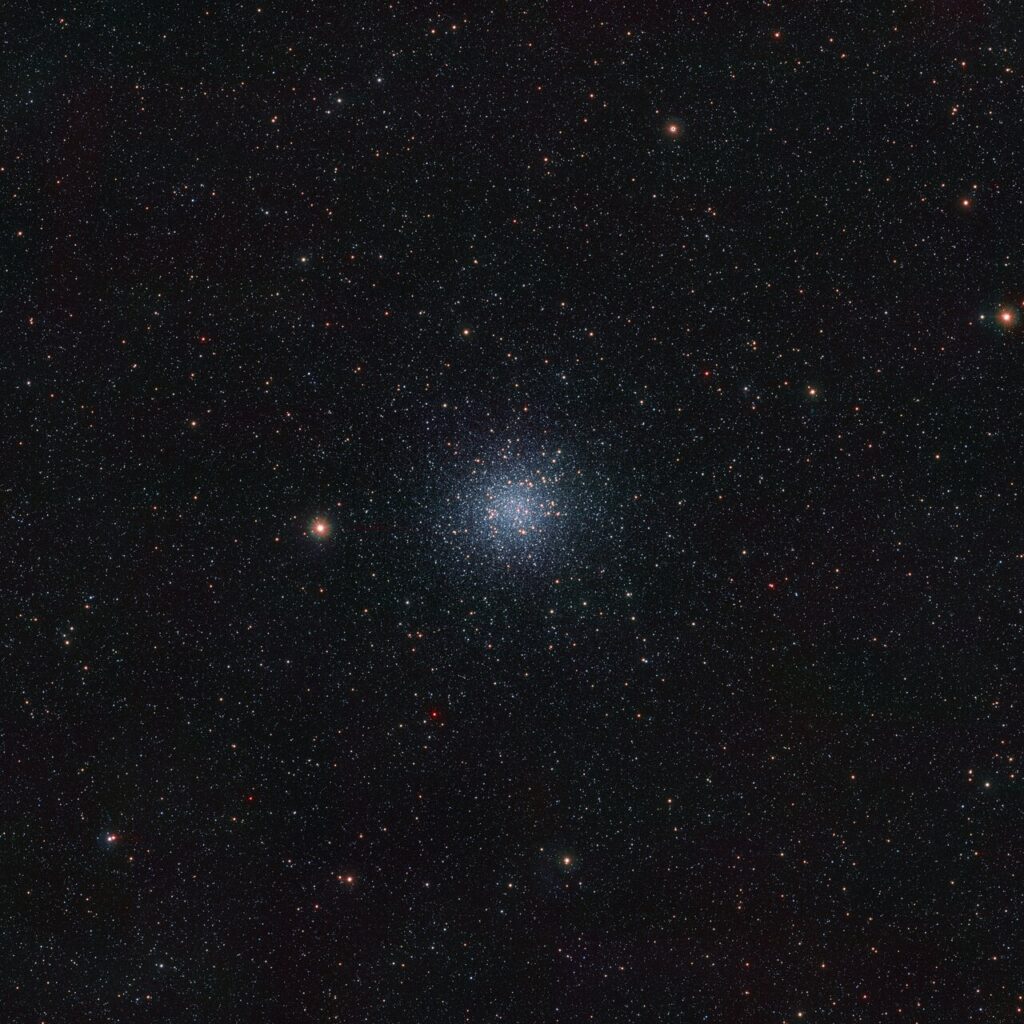
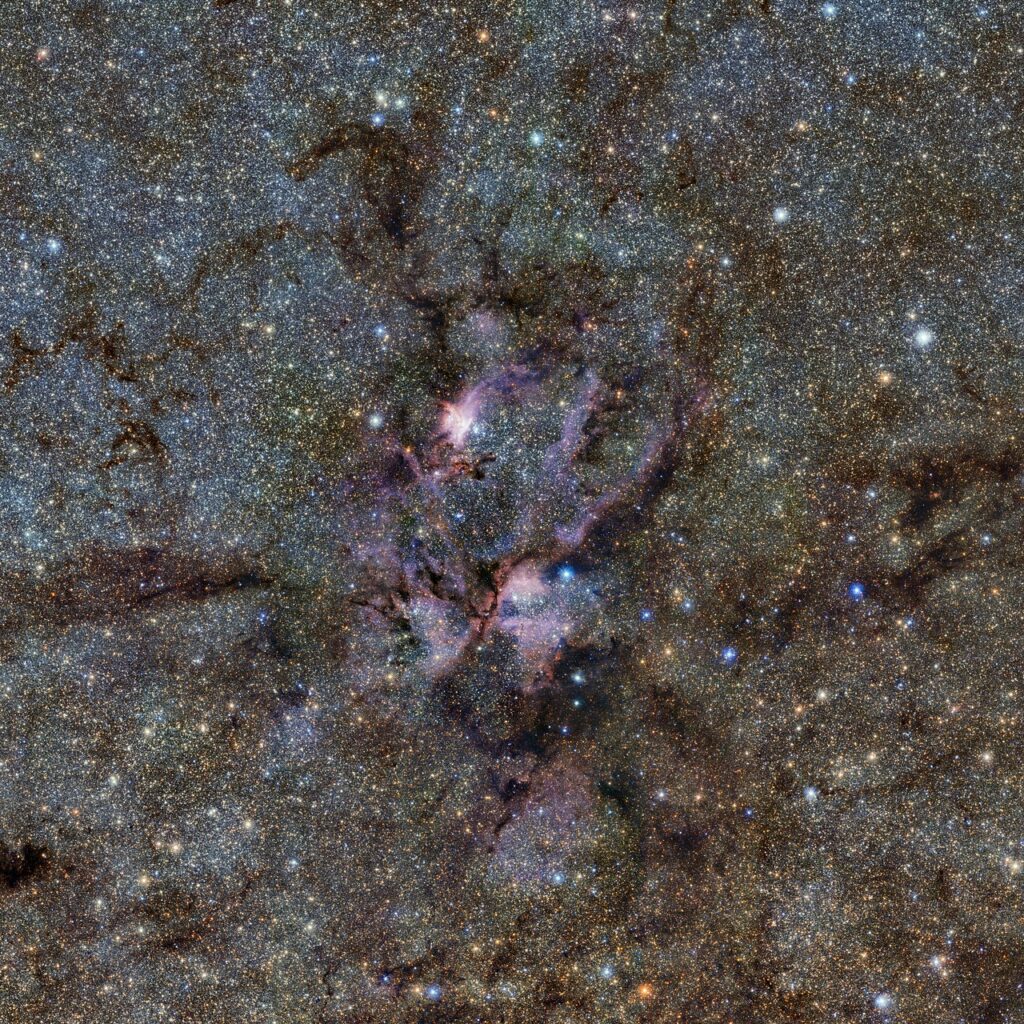
Employees of the European Southern Observatory (ESO) published the most detailed infrared map of the Milky Way in history. It contains more than 1.5 billion objects.
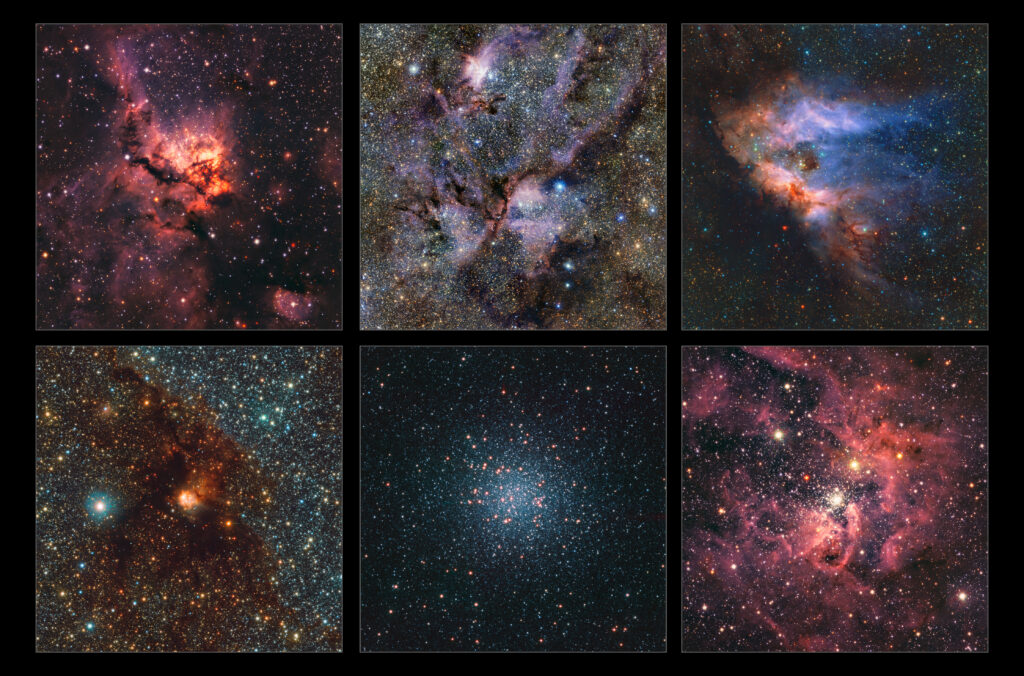
The record map was obtained using the 4.1-meter VISTA Survey Telescope. It is equipped with a three-ton camera with 16 high sensitivity infrared detectors. Thanks to it, the telescope can penetrate through the dust and gas that pervades our galaxy and capture radiation from the most hidden places in the Milky Way.
Work on the map began in 2010 and continued until 2023. In total, VISTA spent 420 nights on surveillance. During this time, the telescope covered an area of the sky equivalent to 8,600 full moons and took 200,000 images. The total amount of data collected amounted to 500 terabytes. The resulting map contains information on more than 1.5 billion objects. This is ten times larger than the previous infrared map of the Milky Way, which was published by the same team in 2012.
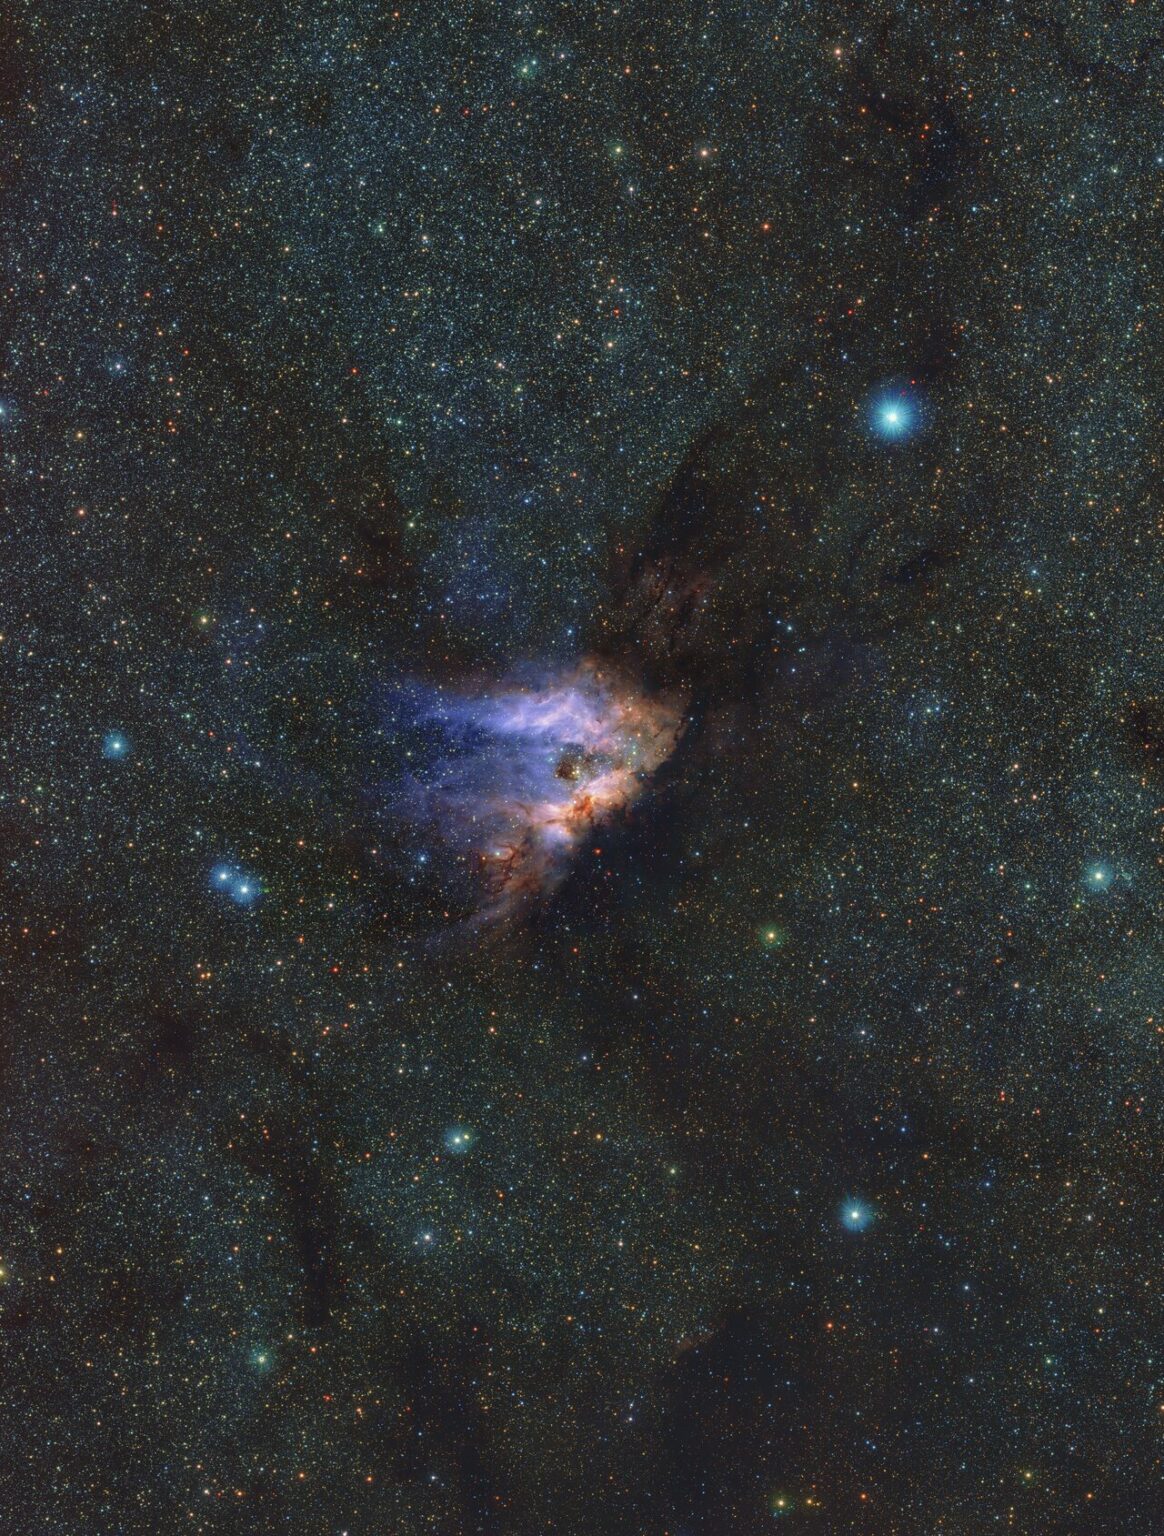
The new map contains information about newborn stars (they are often in dust cocoons, making them impossible to see with conventional telescopes) and globular clusters — dense groups consisting of the oldest stars in the Milky Way. VISTA has also captured very cold objects that predominantly emit in the near-infrared. These are brown dwarfs and free-flying planets that don’t orbit any particular star.
In addition, during multiple observations of the same parts of the sky, the team of scientists was able not only to determine the location of celestial bodies, but also to trace how they move and whether their brightness changes. Next, astronomers used variable stars as a cosmic ruler to determine distances. It made it possible to obtain accurate 3D images of the inner regions of the Milky Way, which were previously hidden by dust.
Researchers have also tracked hypervelocity stars. Fast-moving stars, which usually fly out of the central region of the Milky Way after approaching the supermassive black hole Sagittarius A* lurking there, are called so.
The sky surveys that served as the basis for the new map have already led to the publication of more than 300 scientific papers. This number will continue to grow. A full analysis of all the data collected will take more than a decade to complete. Meanwhile, astronomers are already preparing to create an even more detailed map. It will be possible after the planned 2025 “upgrade” of VISTA and the ESO’s Very Large Telescope.
We previously covered how interstellar clouds could cause an ice age on Earth.
According to ESO
